
Designing Balanced Dice
The “broken” dice algorithm is a highly debated topic. So we researched this comprehensively and we were surprised by the results!

“The odds are way too low to roll a 🎲6 three times in a row!”
“Look at this distribution, it’s nuts, what are the odds of rolling 🎲4 three times more than 🎲5?”
“Wow, I just played a game and the 🎲7 almost didn’t roll!”
Does this sound like you? We heard you!
Read more about our random dice algorithm.
Are the dice broken?
The “broken” dice algorithm is a highly debated topic. So we researched this comprehensively and we were surprised by the results!
2 Common issues players run into:
- Roll Streaks (Example: rolling 🎲4 multiple times in a row)
- Skewed distribution (Example: 🎲3 rolling way more than 🎲5)
“If there are 50 rolls in a game, the chances any number is rolled 3 times consecutively at any points in the game is 3.8%. However, it seems like it happens every other game.” - Source
At your request, we revisited our algorithm and this is what we’ve found...
57% chance to roll the same number three times in a row...
To properly address why this is the case we need to consider the probability of rolling a 🎲2 three times in a row OR a 🎲3 three times in a row… OR a 🎲12 three times in a row then sum all the probabilities together. After running the numbers, for a 50 turn game the chance to roll a number three times in a row is 57%.
Yeah, we were surprised too! The statement "happens every other game" was quite correct.
If you’re curious on how we got to this answer, we broke it down.
Does Colonist dice match expected results?
Next we compared 1 million Colonist.io simulations to the expected results. This is what we found:
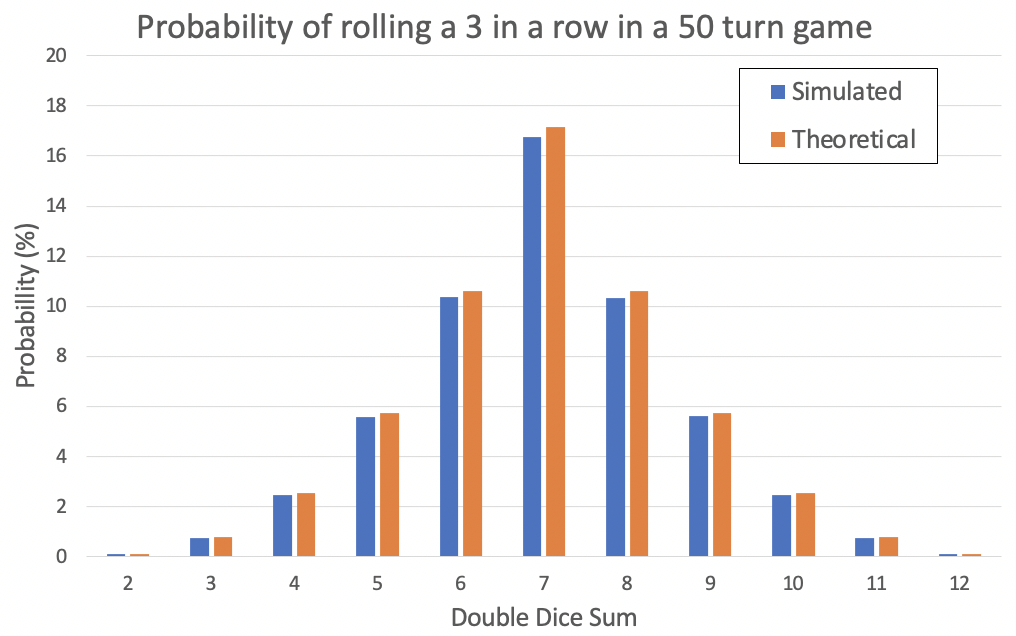
The Colonist.io dice actually has a ~1-2% lower total probability of rolling triples than expected. This is close enough to mimic real dice.
61% chance of rolling non-ideal distributions
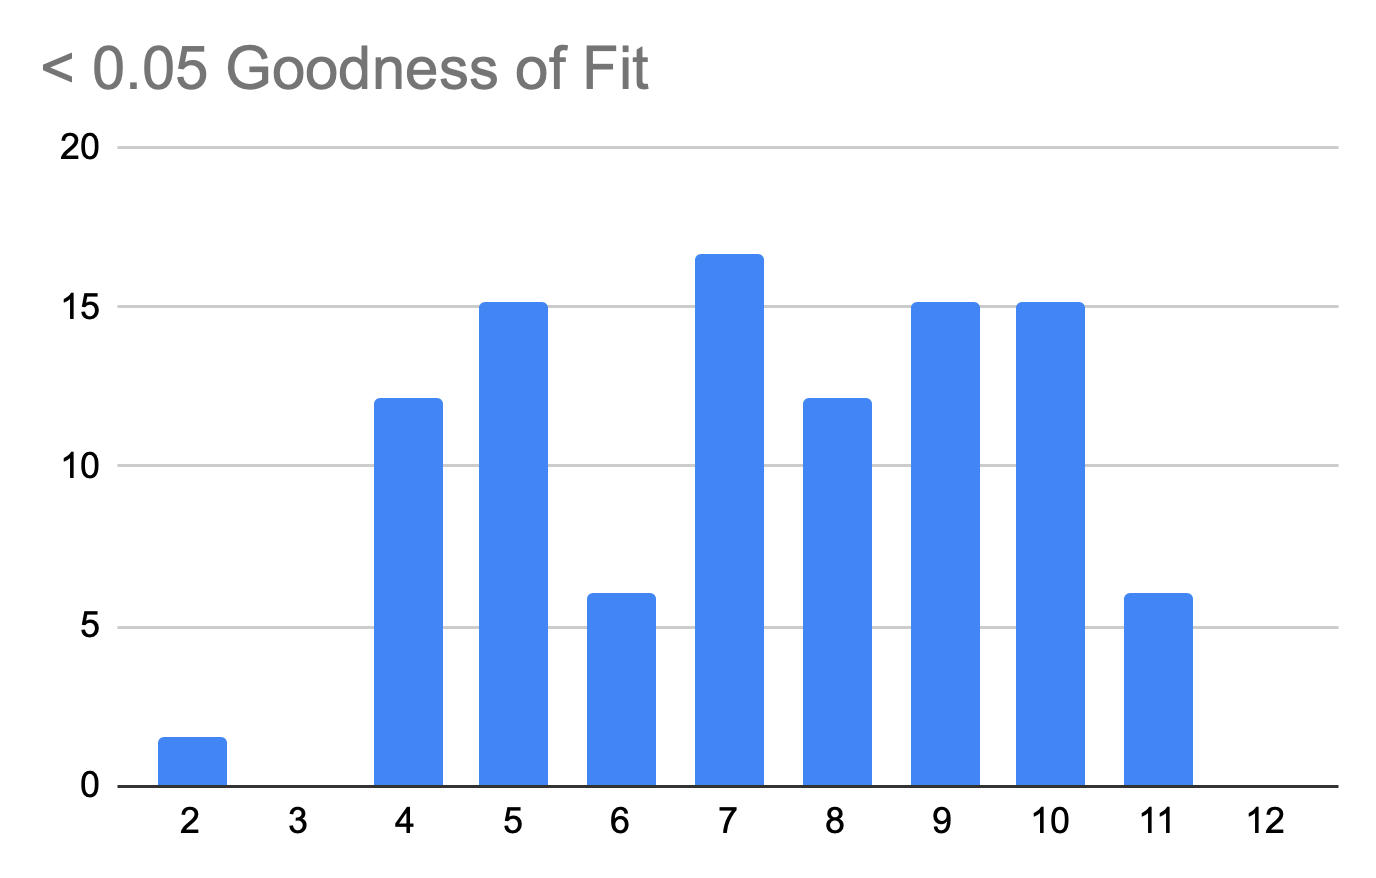
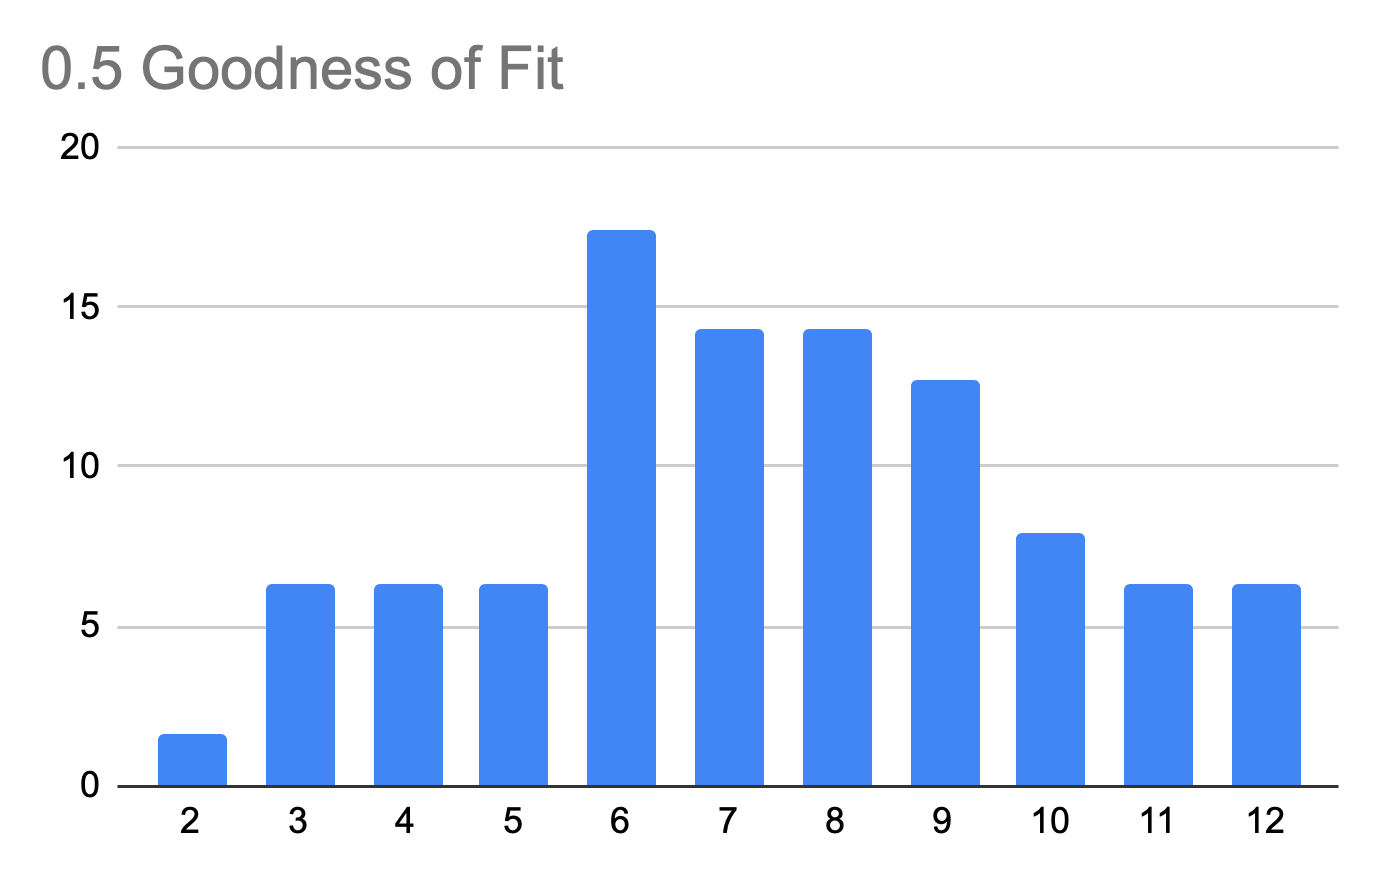
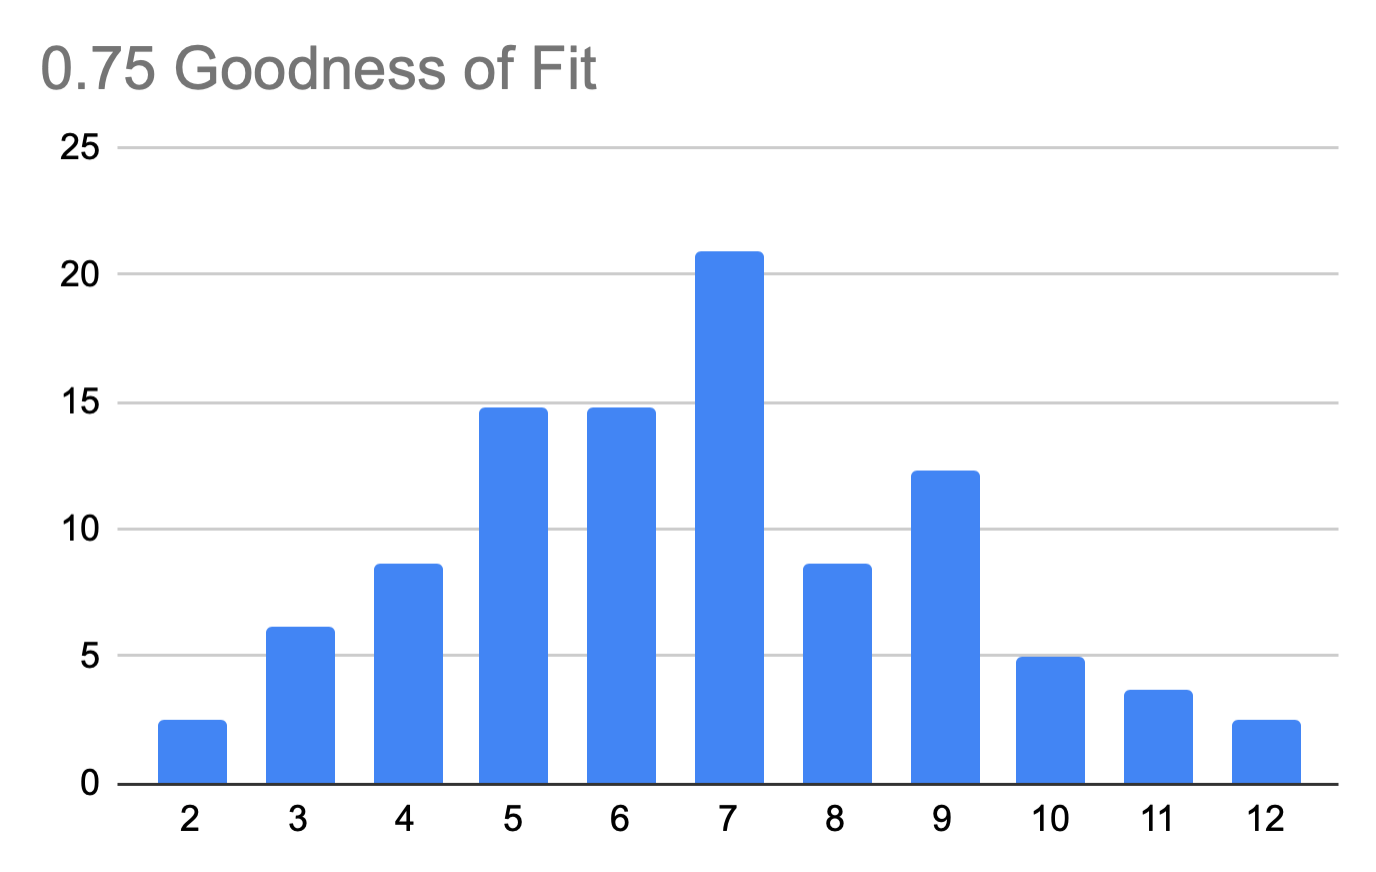
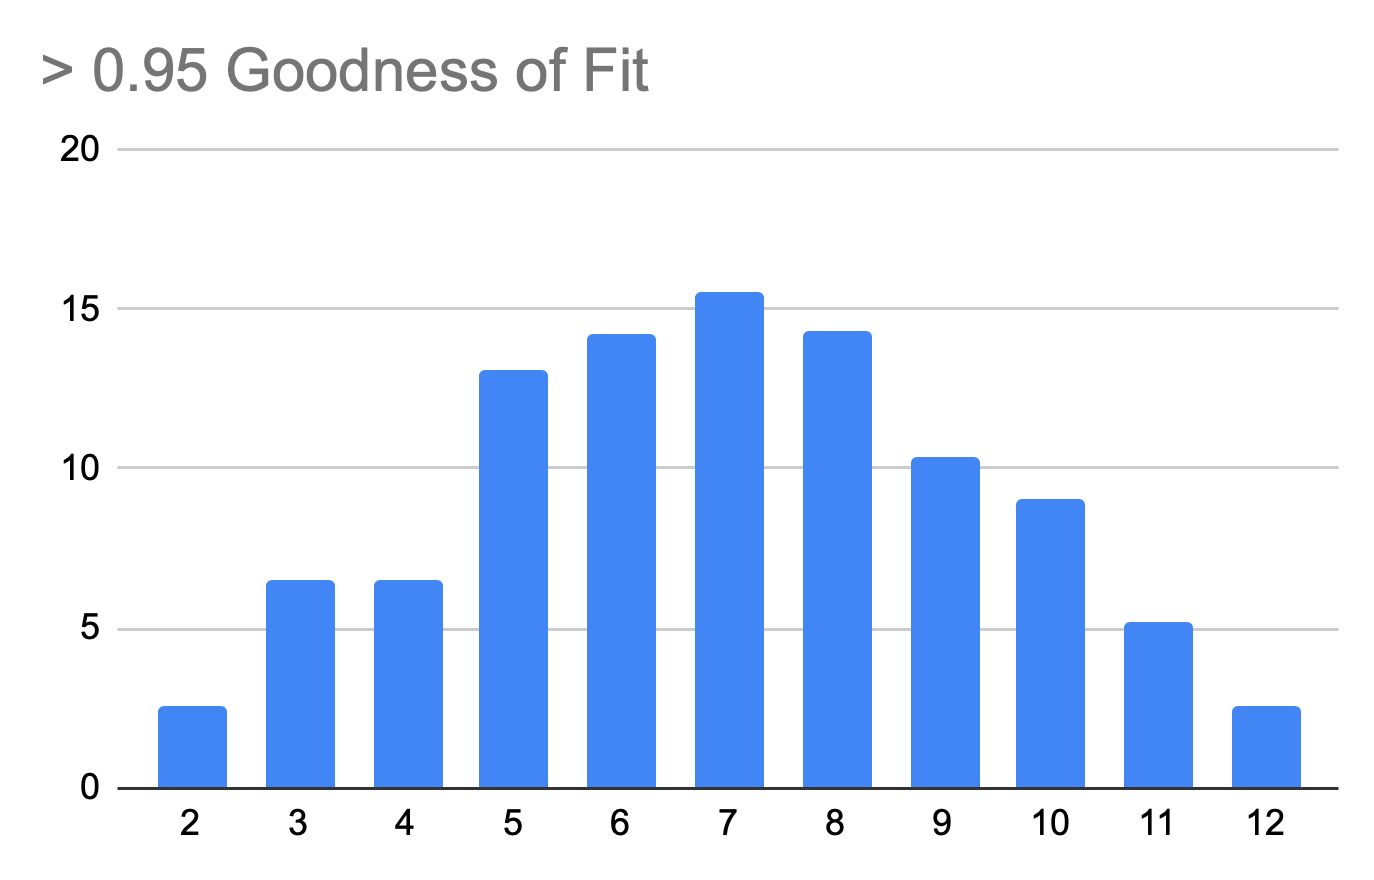
To measure the probability of rolling non-ideal distributions, we used a statistical value called Goodness of Fit. The values span a range from 0 to 1 where a perfect distribution approaches a value of 1. There are more complex explanations but this is a concept more easily visualized. Note below the increasing normality as we increase the Goodness of Fit:
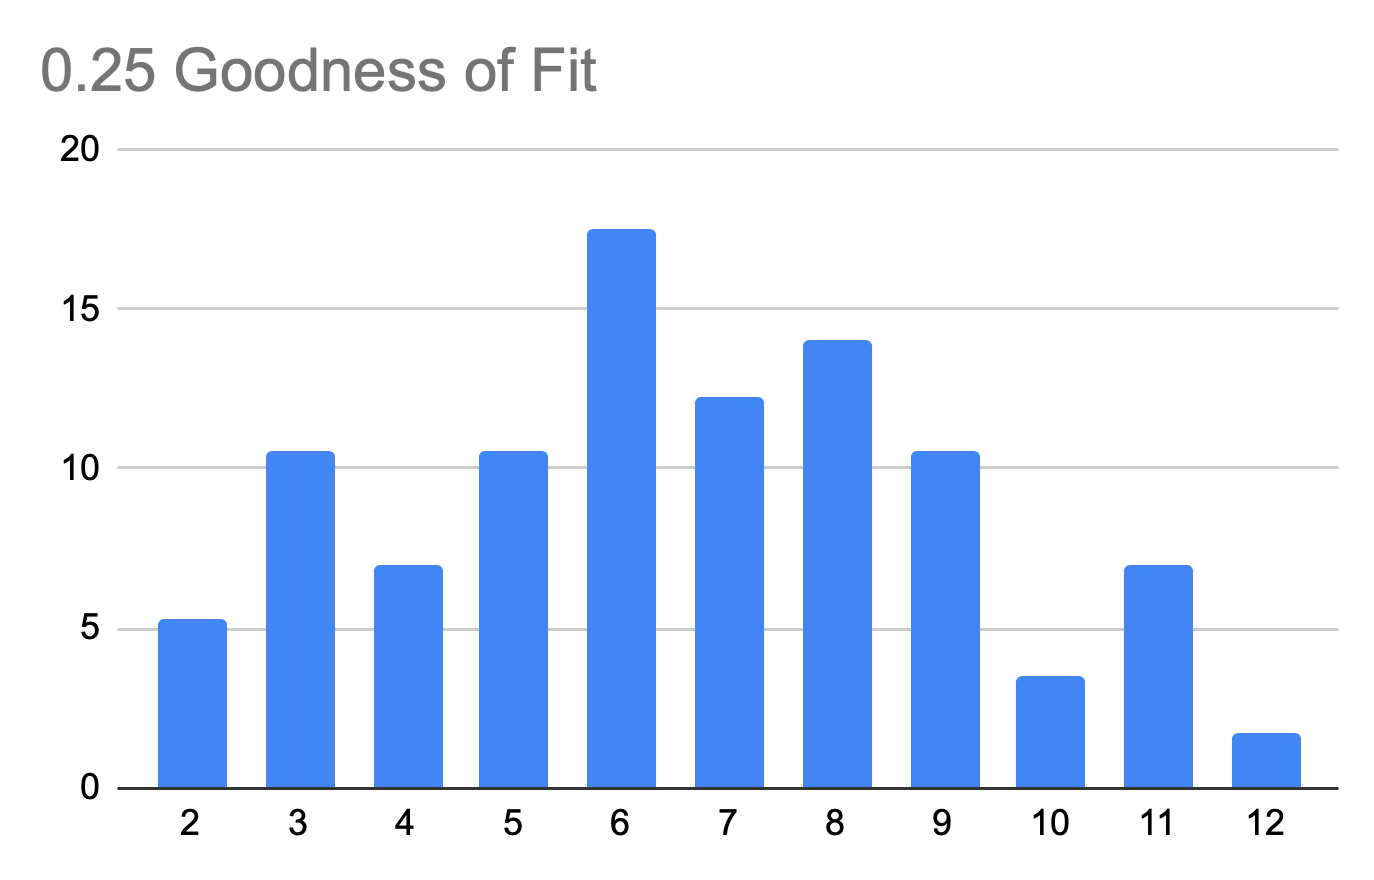
So what is the average Goodness of Fit for a standard game?
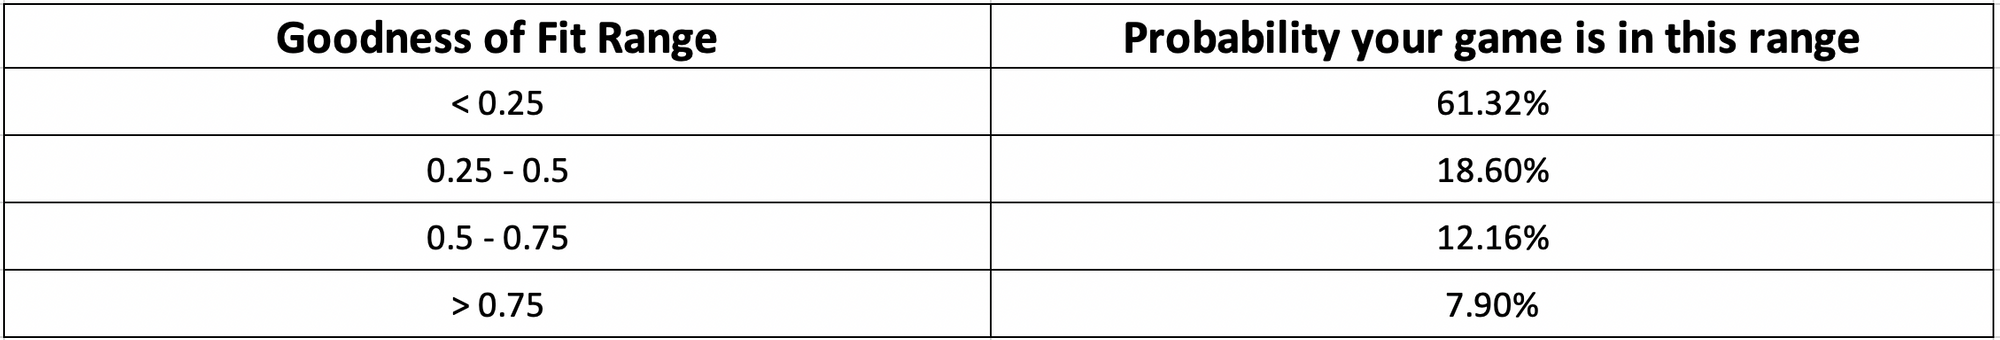
This means 61% of the games have an awful dice graph. Surely we must fix this.
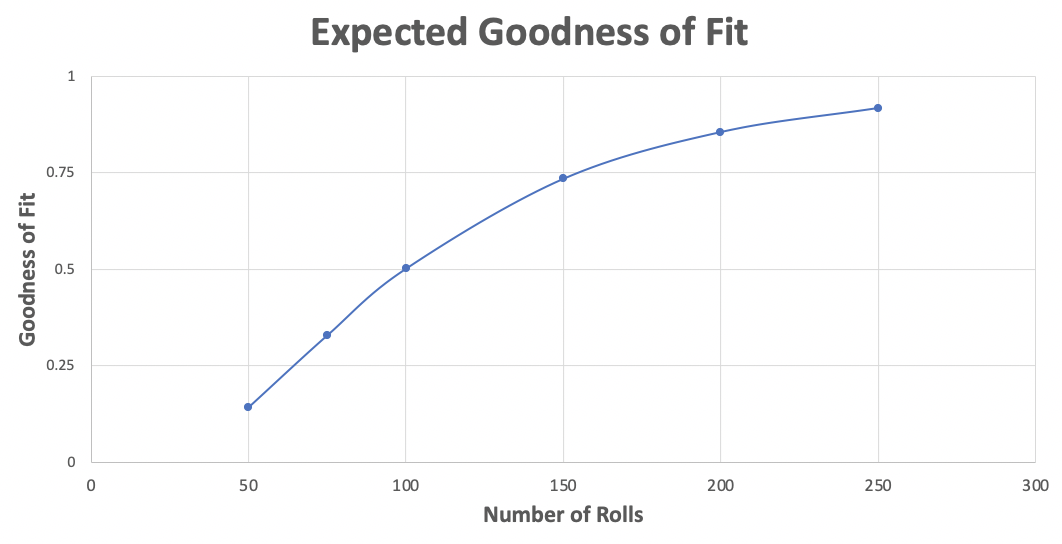
It takes >200 turns to get a good fit
More competitive Colonist players are often quoted saying “This is randomness, games on Colonist aren’t long enough to get an even distribution.” After crunching the numbers, we’ve worked out that games would only be expected to be evenly distributed after 200 turns! That is roughly the length of 4 games!
Implementing the Balanced Dice
While some of the most competitive among you argue that random dice are at the core of the game, this doesn’t change the fact that a large subset of you are frustrated by what can easily be perceived as a lack of randomness. So, as game developers, it was important to us to provide a new optional dice algorithm, Balance Dice, that more closely matches expectations. Don’t worry though, the original Random Dice remains untouched!
Using Dice Deck to control distribution
Dice Deck is a card deck with all 36 combinations found in a 2 dice system. Instead of rolling the dice you draw a card. After the card is drawn it is discarded. This provides an easy way to create a balanced distribution. The problem with a Dice Deck is that it creates a system that is easily countable. To lower the predictability (Goodness of Fit) it is possible to change the point at which the deck is reshuffled:
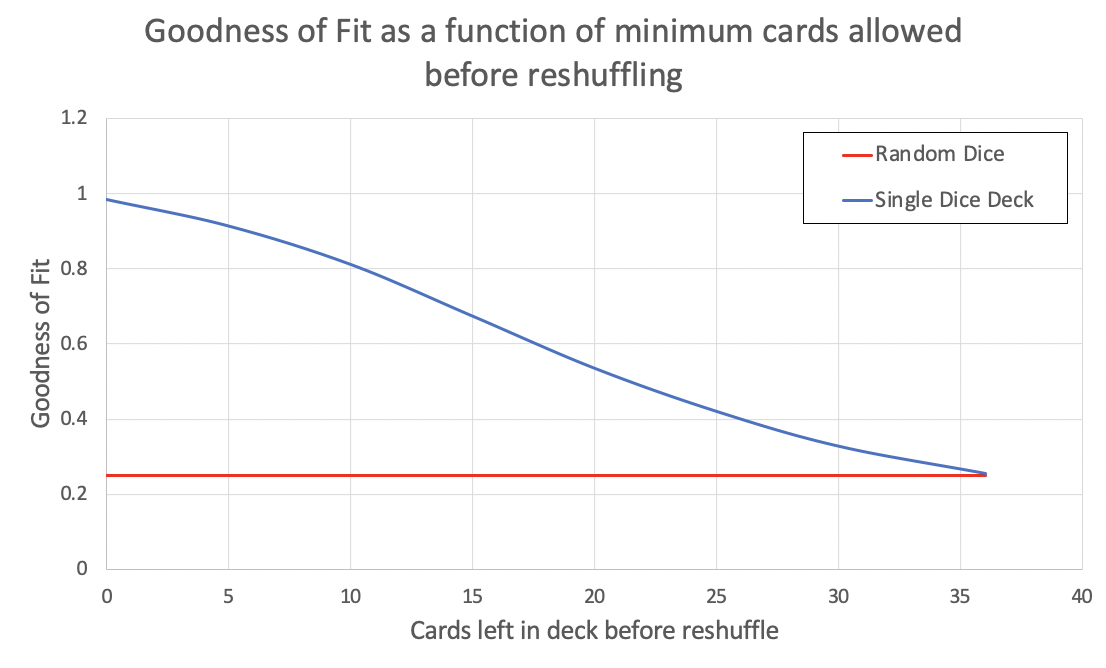
Above you can see that by modifying the minimum number of cards left in the Dice Deck before reshuffling, it is possible to tune the Goodness of Fit expected from the algorithm to closely match an ideal double dice distribution. The range between 10-15 provides a good balance between Goodness of Fit and predictability.
Dice Deck and Roll Streaks
We got a new problem. Though it effectively controls distribution, the dice deck doesn’t lower the probability of Roll Streaks by much. Also, the probability of rolling doubles remains constant despite dice deck configuration.
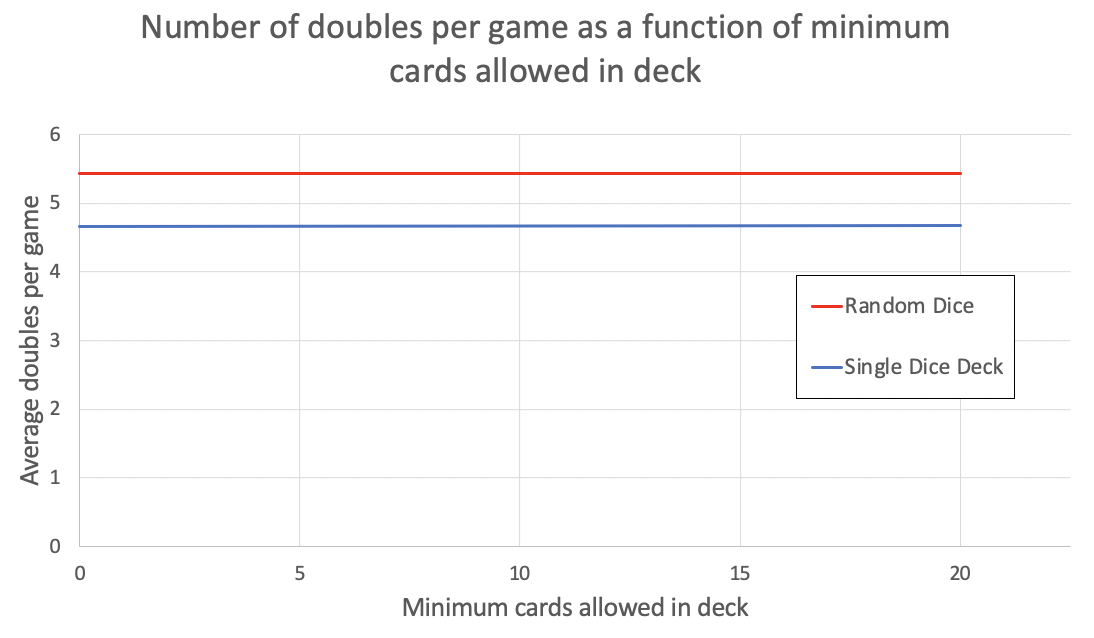
With such a large percentage of you complaining about dice streaks, a simple Dice Deck would only solve part of the problem.
Weighted Dice Deck to reduce the odds of rolling streaks
The only way to reduce the odds of rolling streaks was to lower the odds of rolling the same number consecutively. With this goal in mind a truly tunable algorithm could be created. In the following graph we reduce probability of recent rolls from 0 to 50 and see how it effects "Average doubles per game":
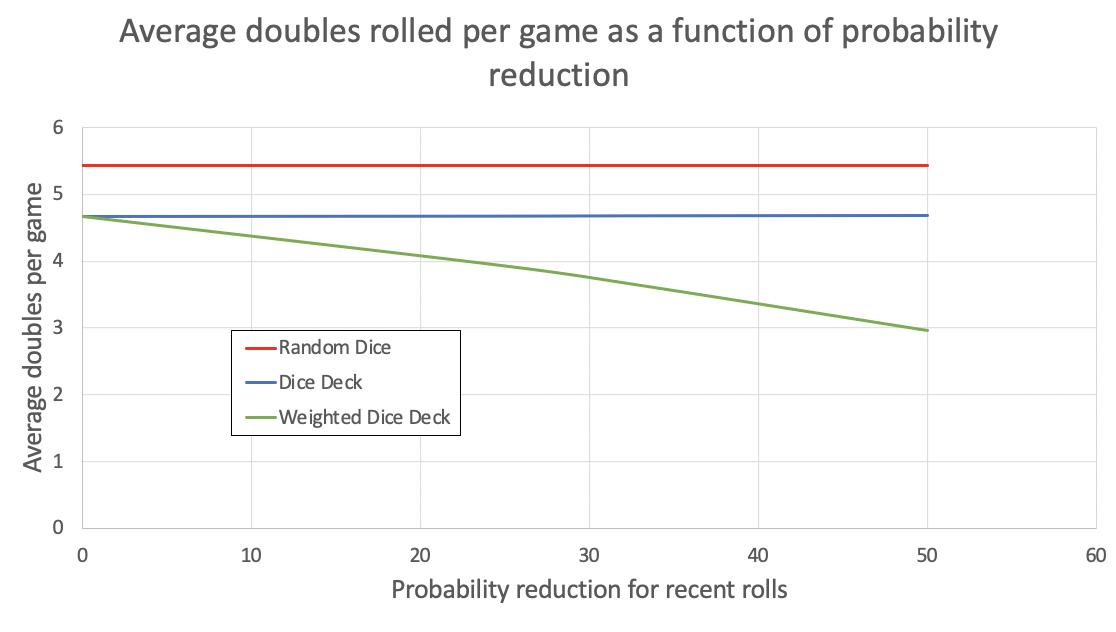
So the final solution had to be a combination of a simple Dice Deck to control distribution paired with a weighted random number generator (RNG) to reduce the probability of Roll Streaks.
Final Balanced Dice Stats
With some fine tuning we landed on the following solution:
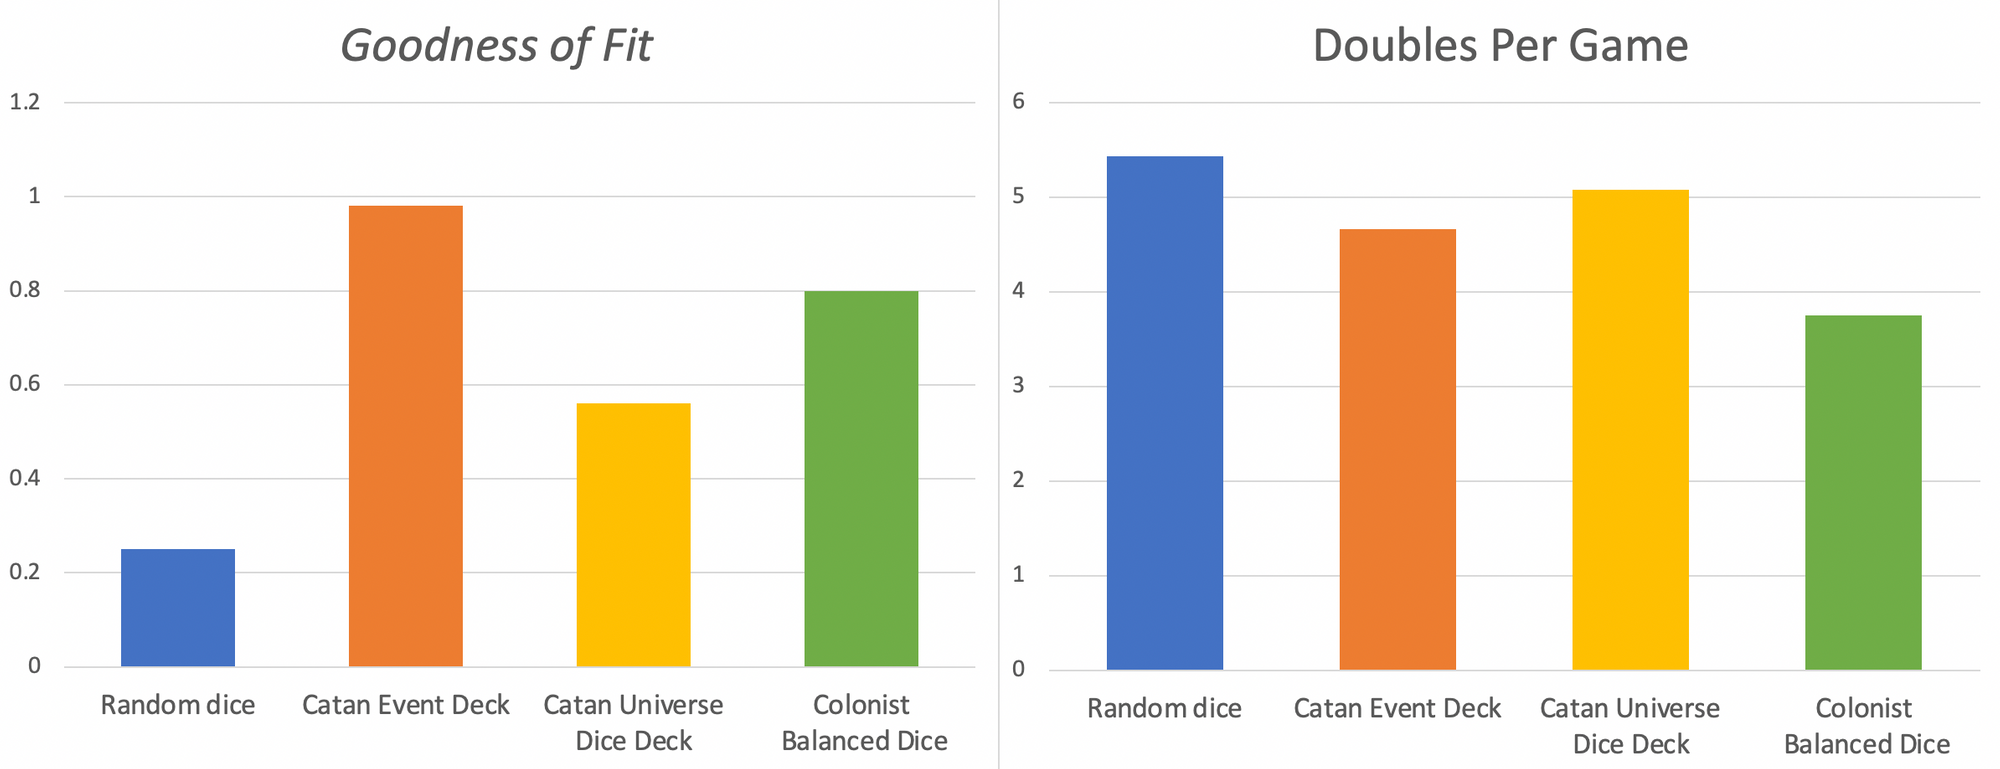
The Colonist Balanced Dice algorithm uses a single Dice Deck with reshuffling at 12 cards remaining and a 30% probability reduction of rolling the same number 2 times in a row. This increases the average Goodness of Fit from 0.25 to 0.8 and decreases the number of doubles per game from 5.43 to 3.75.
The results
Once we made the changes, we asked our play testers to send in example games played with Random Dice and Balanced Dice:
All play testers advocating for Balanced Dice were satisfied with the end results :)
Go try the new Balanced Dice option on Colonist and tell us what you think on our Discord channel!